I love Tridion. There’s a strange elegance to the way she operates, and when I resolve an issue or learn something new there’s no sweeter feeling. But oftentimes sometimes our Tridion can be a cruel mistress – or mister, as you fancy. We configure, install, develop, and implement on her all day long, and just when it seems we understand each other she delivers a sharp slap to remind us that she’s in charge. Saucy.
Developers aren’t timid, however, and we almost always steer directly into the path of most resistance. When Tridion is being a pain in my a… less than cooperative I fall back on the fundamentals. Today, we’re going to talk about remote debugging in Visual Studio, and how we can get it setup quickly and properly. Today, we put a foot down to Tridion, and defiantly state in a firm tone, “Please let this work. Please.”
Prerequisites
As these types of guides go some assumptions are made; we’ll call them “prerequisites†to make it more palatable. That’s not to say that it’s all doom and gloom if you can’t abide by these in your situation, but implementing remote debugging isn’t quite as straightforward otherwise.
- Visual Studio IDE, available to everyone for free in Express flavor, students for free in Professional flavor, and everyone else in various non-Express flavors for large sums of money.
- The workstation hosting Visual Studio is – or can be, via VPN – on the same network as the server that’s hosting the process that you wish to attach to.
- Additionally, you need to be able to log directly onto that server via RDP (Microsoft’s proprietary Remote Desktop Protocol). It’s imperative that you have access to a set of local account credentials.
- You have code deployed in need of debugging. Whether Event System, Template Building Blocks, Workflow, or External Content Library… all of this is redundant if you don’t have a need for it.
- The code base that you’ll be debugging must be the exact same code base that built the remotely deployed binary. That’s because your binary file has a matched symbols file; the same symbols file used for source code mapping with the debugger.
Execution
- Ensure that you’re on the same network as the remote server. While being physically connected to the network is not a requirement it’s very much preferred for the speed benefits alone while you’re debugging. If you’re not physically connected to the same network you’ll need to initiate a VPN connection. This is going to be slower than the physical connection, but how much so is going to depend on a number of networky variables (e.g., your available up/down bandwidth, the server’s available up/down bandwidth, geographical proximity, etc.) that are quite beyond the scope of this post. Suffice to say it will be slower.
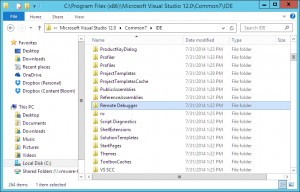
- Acquire the remote debugging monitor. This application resides on the remote server, and once started listens for incoming Visual Studio connections on a specific set of ports (Note: check out Appendix I for tips on working with or troubleshooting the ports that the monitor uses). It’s a lovely little app that borders on magic, but rabbits won’t be exiting hats until you place it on the server. That’s right, you have to provide it. So where will it come from? On the workstation with Visual Studio open a file browser, and navigate to
C:\Program Files (x86)\Microsoft Visual Studio 12.0\Common7\IDE
Don’t worry if you only see Microsoft Visual Studio 11.0 or Microsoft Visual Studio 10.0. They both have what we need, so just choose the highest versioned folder that you have. Within the IDE folder you should see a folder named Remote Debugger. Select the folder, and copy it. Yes, the entire folder. It only constitutes around 60MB, so it’s not exactly heavy lifting. Microsoft makes the remote debugger available via download from its site (x86, x64), so I suppose you could acquire it that way, but why? If you’re thinking just now, “It’ll take longer to copy a 60MB folder across the network than opening a browser on the remote server,†you may find the debugging experience to be painfully, dreadfully, unbearably slooooooow. But who knows? Onwards and upwards…
- Put the remote debugging monitor onto the remote server. You’re already on the network, and should have the credentials you need. Open the Remote Desktop Connection application, which can be found in the Accessories or Windows Accessories folder of the Start Menu on your workstation, depending upon the version of Microsoft Windows or Microsoft Windows Server you’re running. Connect to the remote server – machine names work, but IP addresses work best - and navigate to the Desktop. Paste the folder right here. You can place it elsewhere if you like, but in my experience I’m rarely the only chap remoting into the server; such a useful tool needs to be seen by all who might benefit from it! The Desktop also helps to prevent redundant copies of the same files if you or a colleague happens to forget that you already dropped the remote debugging monitor on that server.
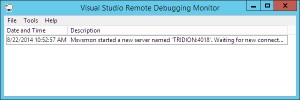
- Start the correct instance of the remote debugger. While we’re RDP’d into the remote server let’s go ahead and fire up the debugger. Navigate into the Remote Debugger folder that we just dropped onto the Desktop of the server, and we’re immediately presented with a challenge: x86 or x64? The answer depends on what you intend to debug. It’s very simple: if you’re going to attach to a 32-bit process use a 32-bit debugger (the x86 folder); likewise, if you’re going to attach to a 64-bit process use a 64-bit debugger (the x64 folder). Head on in to your chosen folder, and look for msvmon.exe. Double-click to start, and a small window will appear letting you know that it’s now listening for connections. Update: a reader has pointed out that it might be necessary to execute msvmon.exe as administrator. While I’ve personally never run into this particular need I could see where it might be warranted, so long as you’re identified as an administrator on the host server. To do this, you need only right-click msvmon.exe and select “Run as administrator” from the context menu.
Note: Most of Tridion’s running processes are 64-bit, but if you’re not sure which debugger to use I’ve included a list of Tridion’s processes, along with the components of Tridion they’re responsible for running, in Appendix II down below. If you’re presented with a Windows message along the lines of, “Configure Firewall for Remote Debugging,†take a look at “Appendix I: Remote Debugger Port Availability,” also at the end of the post.
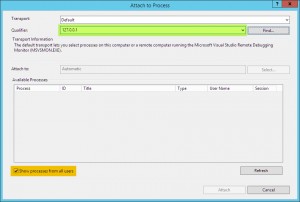
- Attach to the process from within Visual Studio. Minimize the Remote Desktop Connection application – it’s convenient to keep it open in case you need to troubleshoot, at least until you establish the remote debugging session – and open Visual Studio, followed by the project or solution that you wish to debug. Click Debug > Attach to Process… In the dialog that appears checkmark the “Show processes from all users†checkbox, and place your cursor into the Qualifier field at the top. While you could certainly use the machine name of the remote server I’d highly recommend using the IP address instead, as the machine name may or may not resolve while the IP address will every time – so long as it’s accessible, of course. Input the IP address of the remote server into the Qualifier field, and click the Refresh button. It’s likely that the server is going to need credentials before it lets you take virtual control of its internal organs, so feed in the same credentials you used to initiate the Remote Desktop Connection if you’re prompted. Otherwise, it may take a moment, but with a little luck the “Available Processes†list should populate with all of the active processes running on the remote server. Click the process you wish to attach to, and click Attach.
Note: For a list of the processes that Tridion uses to process or facilitate various functionalities check out Appendix II down below.
- Set a break point, and trigger it to be hit. This is probably obvious to most of you, but I’m including it in order to speak on a topic of importance to those attempting this in an enterprise environment, and that topic is the impact that debugging is going to have on the CM. If you’re debugging a Template Building Block assembly, or maybe the event system, when your breakpoint is hit the Tridion interface will go into a state of limbo; it can’t execute while you have a handle on a piece of its guts. If there are others working in the same environment they will be impacted. Proceed accordingly.
And that’s it! The next time Tridion becomes a little sassy uncooperative, and the difference between a self-inflicted bald spot and blissful sanity is your own code, you can kick off a remote debugging session, or as I like to call it hero mode. Engage.
This is my first of many posts here on Tridion Developer, and if you’ve made it this far you were either desperate for the information or you were entertained. Either way, thanks for reading. I’m always looking for new topics to learn and blog about, so feel free to toss me some hot tips at rob@contentbloom.com.
Appendix I: Remote Debugger Port Availability
Before we can determine whether the debugger ports are even available we need to know what ports to look for. According to Microsoft:
Opening a hole in the firewall for remote debugging unblocks DCOM (TCP Port 135) and IPSEC (UDP 4500 / UDP 500). In addition, it allows the debugger to open additional ports.
Figuring out whether the remote server is blocked on those ports is actually pretty simple, and it’s uber easy to do right from your workstation.
- Make sure you’re on the same network as the server you’re going to poll, whether by physical or VPN connection. Not much point in continuing otherwise.
- Open a Command Prompt. There are a number of ways to do this – I enjoy using an Explorer window, and just typing cmd into the address bar.
- At the prompt:
telnet [host] [port]
Note: Telnet is disabled by default on Windows Vista and above. It’s a fairly handy tool to have about, and enabling it is pretty straightforward: Start > Control Panel > Programs > Turn Windows Features On or Off > select “Telnet Client†from the list > OK. If you’re unable (or unwilling) to use Telnet, fear not; PuTTY is a free Telnet/SSH/xterm implementation that’s ready for use without installation. Download, unzip if necessary, and use.
Where were we… ah, yes, the results of our Telnet attempt. You’ll get one of a few responses:
- “Connection refused†means that it’s unlikely anything is running on that port. Until you start the debugger you should receive this message.
- “Timeout†is the one to worry about. It means that a firewall is blocking access to the port on the target machine. We’ll discuss remedies momentarily.
- “Accepted†seems pretty obvious. Something is running on that port, and you’re allowed connect. If the debugger has been started – and all is well – this is what we want to see.
If you find that you’re unable to start the debugger due to blocked ports, get with your network administrator to hopefully get these unblocked. Enterprise network configurations will likely not have much to worry about if the CM server isn’t on the DMZ (i.e., you can only browse the Tridion CM while on premises or VPN), but your results may vary. Sadly, if it turns out that you’re unable to have those ports unblocked there is no alternate solution. You’ll need to resort to more traditional methods of debugging to resolve any potential issues.
Appendix II: Architecture Mapping of Tridion’s Running Processes
There are a number of processes that Tridion relies upon under the hood. Some are pretty straightforward, while others – I’m looking at you, event system – vary by what you’re implementing. The list below seeks to identify those processes you’ll need to attach to in order to debug the various pieces of dynamic functionality within Tridion.
- TcmTemplateDebugHost is useful for debugging .NET assembly Template Building Blocks running inside Template Builder.*
- TridionServiceHost is used for debugging External Content Library (ECL) extensions, as well as publish events in the Event System.**
- dllhst3g is used for debugging the Event System.**
- cm_wf_svc.exe is used in the debugging of Workflow.
32-bit Processes
- w3wp is an IIS worker process that (was? is?) useful in debugging .NET assembly Template Building Blocks during a live publish directly from the CM. (I recall attaching to this in Tridion 2011 to debug TBBs, but YATB mentions dllhost or dllhst3g for this purpose.)
* – Should you find multiple instances of this process running remotely you can determine which one to attach to by matching the Process ID (PID) found in the list of available processes in the Visual Studio dialog to that found in the very first line of the Template Builder console. The line will appear as, “Debugging has started in process ‘TcmTemplateDebugHost’ with ID 9876,†where 9876 is the PID.
** – Attaching to a process that’s used directly by the CM can have a negative impact on the performance and usability for other users. Proceed accordingly.


Thanks for the great, easy to follow explanation. One thing: to make it work I usually need to run the remote debugger (msvmon.exe) as administrator.
Thanks for reading, Quirijin. I’ve not run into that issue personally, but I could definitely see a need for it depending upon your infrastructure implementation. That’s a good point, and I’ll certainly make a note of it.
Loving the detail here Rob, thanks very much! I often though this was tricky but you made it very easy indeed.
I had one small trip-up: When connecting via the Qualifier it failed to find the ‘msvmon’ process because I was using Visual Studio 2012 (on client) and Visual Studio Debugger 2013 (on server), they are incompatible. I installed Visual Studio Debugger 2012 and it connected fine.
Just a small one to watch out for.