Recently I’ve been performing some post-launch improvements to a DD4T site for a client. Â A number of their requests have been along the lines of improving screen element <x> on page <y>.
The project is reasonably large with the website being comprised from a couple of hundred abstract MVC views. Â A good amount of nested, view re-use, with nice generic css classes has actually been a detriment when it comes to tracking down exactly which view screen element <x> originates from.
Occasionally you find a view that includes some ‘start’ and ‘end’ comments in the output.
<!-- Start View: Example -->
  View contents go here...
<!-- End View: Example -->
That helps, but is not present in every view, and if it was…..meh what a mess the rendered output would be…..all those extra comments transmitted with every page request, over slow mobile phone networks, with sketchy reception. Let’s improve upon that shall we?
So most MVC projects use Razor as their render engine.  This engine is responsible for taking our MVC views, compiling them and producing the end output.  It’s just another DLL in the web request pipe-line, and like most DLL’s it can be replaced with one that produces the output that we want.
Before getting stuck into the code, I find it’s always a good idea to take a look at a decompiled version of the code you’re looking to replace or shim.
A quick look in System.Web.Mvc library and I couldn’t be happier.  The RazorViewEngine class suggests that the class itself is relatively simple.  We will also have to create our own RazorView class to actually implement our change.
If we look to stick as closely to the default behaviour as possible though then things should go pretty smoothly. Â So our custom view engine looks like this:
Nice, slim code that does all the default behaviour of the Razor View Engine, except it returns our DebugView class instead of the Razor View class. Â Speaking of which:
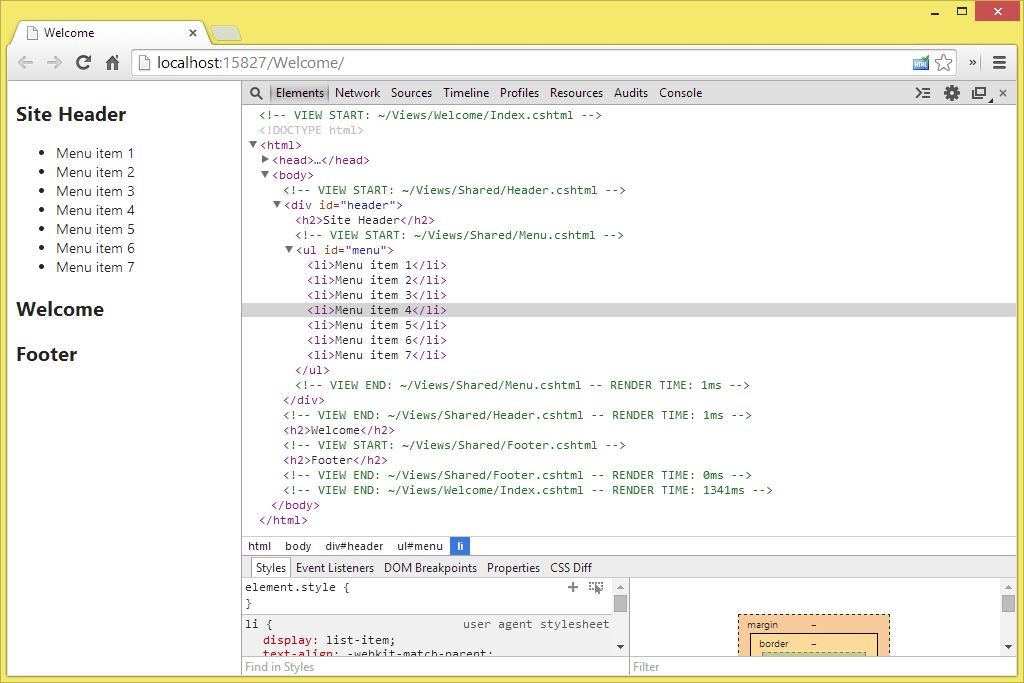
We override the RenderView method with our own version and insert some extra output before and after the call to the base method. Â The result of which is…..
We can immediately see where each view begins and ends, complete with the render time to highlight possible areas for optimisations.
When hooking up our custom view engine, we can of course do it inside a #if debug statement so that the extra output is not included in the live version of the site.
A working example of this can be downloaded here. Â Enjoy!


